A+A Stats
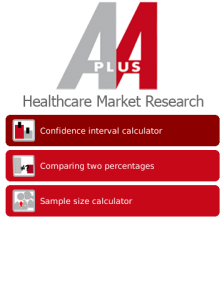
3 common statistical tools used to analyze market research results:
1.CONFIDENCE INTERVAL CALCULATOR
2.COMPARING TWO PERCENTAGES
3.SAMPLE SIZE CALCULATOR
CONFIDENCE INTERVAL Level of accuracy in percentages observed:
based on a sample of 253 respondents, 38% are found to be users of product "A
What is the accuracy of the observed 38%
There is 95% probability that the actual percentage in the total population is between 36% – 42%, i.e. confidence interval at 95% is 36% – 42%.
This confidence interval can be calculated for any sample size, any observed percentage, at different levels of confidence 95%; 99%, 99.9% etc..
STATISTICAL SIGNIFICANCE BETWEEN 2 OBSERVED PERCENTAGES:
Based on a sample of 253 women, 38% were found to use brand A.
Based on a sample of 175 men, 32% were found to use brand A.
Is the use of brand A significantly different between men and women?
Yes, at 95%. there is a risk of 5% when assuming there is a difference
Calculations should be undertaken in order to evaluate whether 2 percentages measured on any two independent sample sizes are significantly different at different confidence levels 95%; 99%, 99.9% etc.
MINIMUM SAMPLE SIZE CALCULATIONS:
38% of women are expected to be using product A.
In order to measure the proportion of women using product A with a confidence interval of +/- 3, how many women should be included in the research?
Calculations should be undertaken in order to determine the minimum sample size required, at any percentage, and for any desired confidence interval, given varying confidence levels 95%; 99%, 99.9% etc.

App Name:A+A Stats
App Version:1.0.0
App Size:957 KB
Cost:FREE