PBDataPlayer
PBDataPlayer is a data visualization tool to explore data and spot anomalies.
Three dimensional data can be thought of as layers of two dimensional graphs, layers extending third dimension.
People have a better feel for graphs than numerical tables. Interactive graphics are supportive of analytics and reporting. People spot changes and nuances more easily in visual presentations.
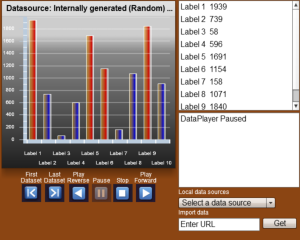
PBDataPlayer animates tabular data. It presents a slice of a cube as a 2D column graph and animates a dimension.
PBDataPlayer accepts tabular data in CSV in format and animates it.
PBDataPlayer data format
Use PBDataPlayer to analyze data before you apply advanced analytic techniques
like using OLAP analysis and spend time to setup Cubes and slice and dice, you can
examine your data for clues. PBDataPlayers basic data is a table .csv file,
which can be prepared by using many different tools/programs/scripts. You can use any
query engine to extract data from relational or other kinds of databases and produce .csv file.
PBDataPlayer expects input data in table format
State Col1 Col2 Col3
A 12 45 56
B 7 17 21
Each row represents a 2D column graph. Col1, Col2 .. are categories for the columns. Numerical values are heights of columns in the graph. First column identifies state. The animation engine draws a graph for each state. You should ensure that values are in numerical format. Category label is a string of characters. Labels should not contain special chars like , \" . This version of PBDataPlayer does not validate data.Sunspot data in CSV file looks like:
Year,Jan,Feb,Mar,Apr,May,Jun,Jul,Aug,Sep,Oct,Nov,Dec
1749,58.0,62.6,70.0,55.7,85.0,83.5,94.8,66.3,75.9,75.5,158.6,85.2
1750,73.3,75.9,89.2,88.3,90.0,100.0,85.4,103.0,91.2,65.7,63.3,75.4
1751,70.0,43.5,45.3,56.4,60.7,50.7,66.3,59.8,23.5,23.2,28.5,44.0
1752,35.0,50.0,71.0,59.3,59.7,39.6,78.4,29.3,27.1,46.6,37.6,40.0
This version supports up to 12 columns and 300 rows
App Name:PBDataPlayer
App Version:1.0.0
App Size:759 KB
Cost:FREE