NE App
NE App BlackBerry Application For Reading NE Meter Data
THIS APP IS ONLY FOR USE WITH THE NE METER. USE THE FOLLOWING DEMONSTRATION ACCOUNT IF YOU DO NOT HAVE ONE:
USER: demo
PASSWORD: demopassword
It works with your NE Meter account. The user can track usage, predict future costs, and diagnose electrical problems. Data can be viewed in graphs, tables, or the convenient data view that shows recent and predicted future usage.
The app is divided into four sections separated by tabs: Data View, Graph View, Table View, and Configuration.
Data View:
The Data View section displays the most recent, most relevant metering information. Metering alerts will pop up in this section if enabled see Alerts.
Data View shows the time and kWh reading of the selected meters most recent read, as well as kWh usage and cost for time intervals of Today, This Week, This Month, and This Year. Projected values are shown as well.
Meter Connection Status
The meters connection status for the Wifi connection and the adhoc connection is displayed by touching the status button at the bottom of the Data View. For the both connections, the status, signal strength, and link quality are displayed.
Graph View:
The graph defaults to kWh Usage for Today. To change the data type, touch the kWh label on the Yaxis of the graph and a dialog will pop up where the user can scroll through possible data types and make a selection. To change the Time Interval, touch the Xaxis label of the graph and select the desired time interval.
The available data types for the Yaxis of the graph are:kWh, Cost, kW, kVA, kVAr, kVAh, kVArh, Carbon Footprint, Power Factor, Voltages A, B, and C, Currents A, B, and C, and Pulse Inputs A and B.
The available time intervals for the Xaxis of at the graph are: Today, This Week, This Month, This Year, and Custom.
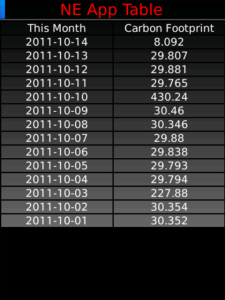
Table View:
The Table View allows the same functionality as the Graph View, except the data is shown in a 2column table instead of a graph. The left button at the top of the table is for selecting the data type and the right button is for selecting the time interval. The data types and time intervals including Custom operate the same way as for the Graph View.
Configuration:
The Configuration section allows the user to log in, choose a meter, and set or change the rate for that meter. User names and meters associated to the managers account must be previously set up by Global Power Products. To log in, simply type the user name and password into the specified fields and press the Update button. The meter will be used on all sections of the NE App.
Alerts:
The NE App gives the user the option to display pop up alerts in the Data View for a power outage, dropped phase, or exceeded usage limit.
App Name:NE App
App Version:1.0.2
App Size:232 KB
Cost:FREE